P1TS is a web service that helps
SRO Motorsports
competitors understand their live race, practice, and qualifying sessions.
Its clear interactive displays help team members to make critical real-time decisions
using lap times, gap times, driving times,
pit times, etc. data and visualizations.
 |
| Laptop |
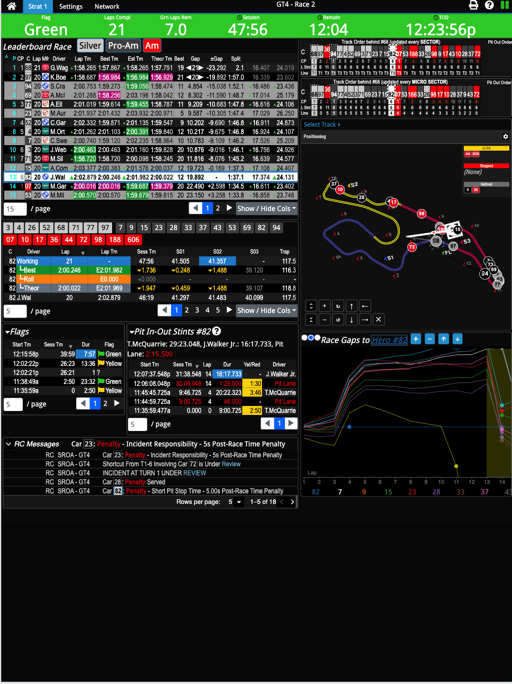 |
| Tablet |
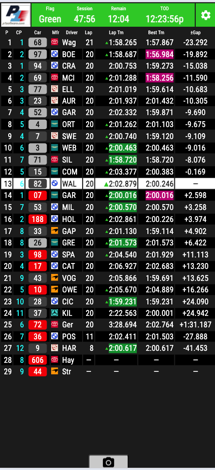 |
| Phone |
Requirements
Since P1TS is a web service, there is no software for you to install or update.
It requires only:
- Google Chrome browser on Windows or Mac (above left), or
iOS or Android tablets (above right)
- Internet connection - Track WiFi, cellular, Starlink
- NEW AKNA V2 Protocol License -
https://store.alkamelnorthamerica.com
for purchase
- P1TS License - http://www.p1ts.com
has a Pricing link (we invoice you)
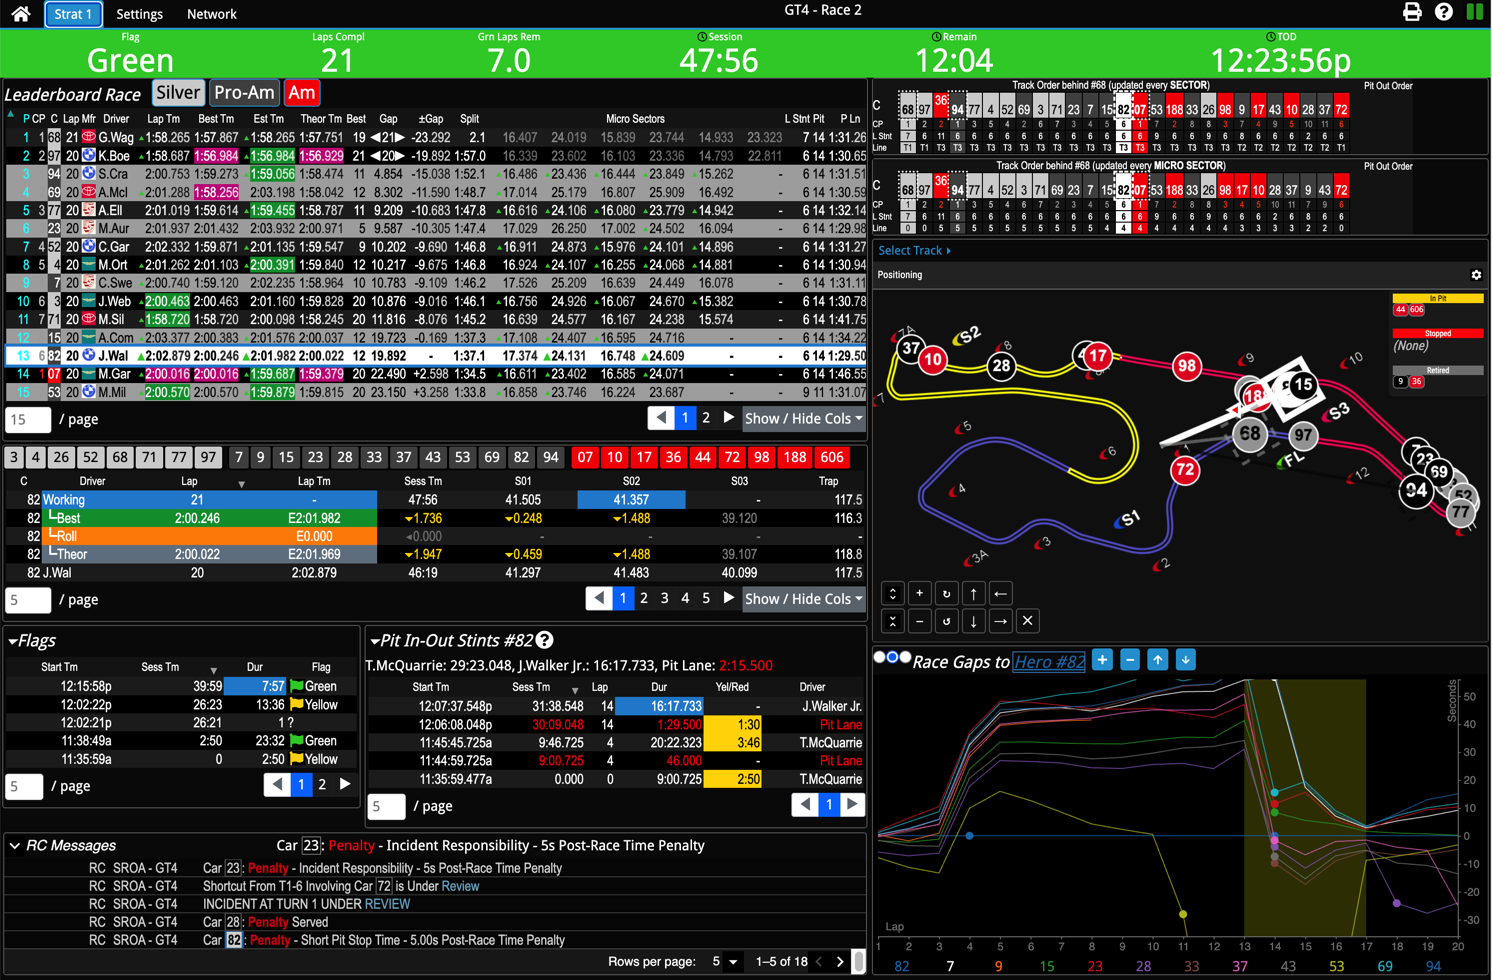
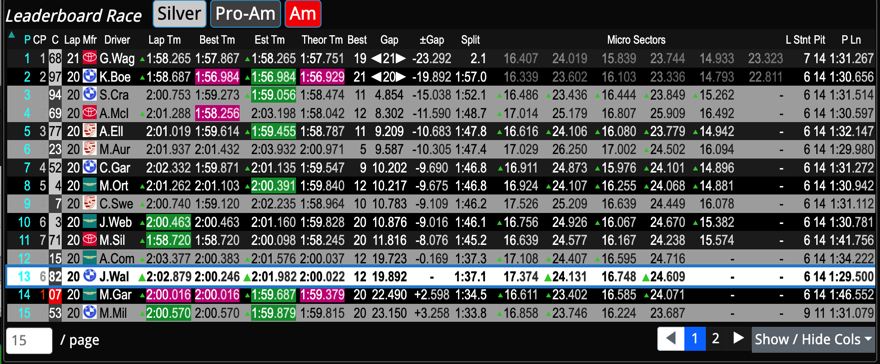
Leaderboard
The Leaderboard table displays key data about each
competitor.
- Your Hero car (#82), Sister cars (none shown),
and other cars or classes you want to closely Follow
(PRO-AM) are highlighted.
- See the +/- Gap between your hero and competitors.
- See how many laps they have driven in their current stints (L Stnt).
- Besides 3-Sector times (hidden), you can display the (6) NEW
Micro Sector times.
|
|
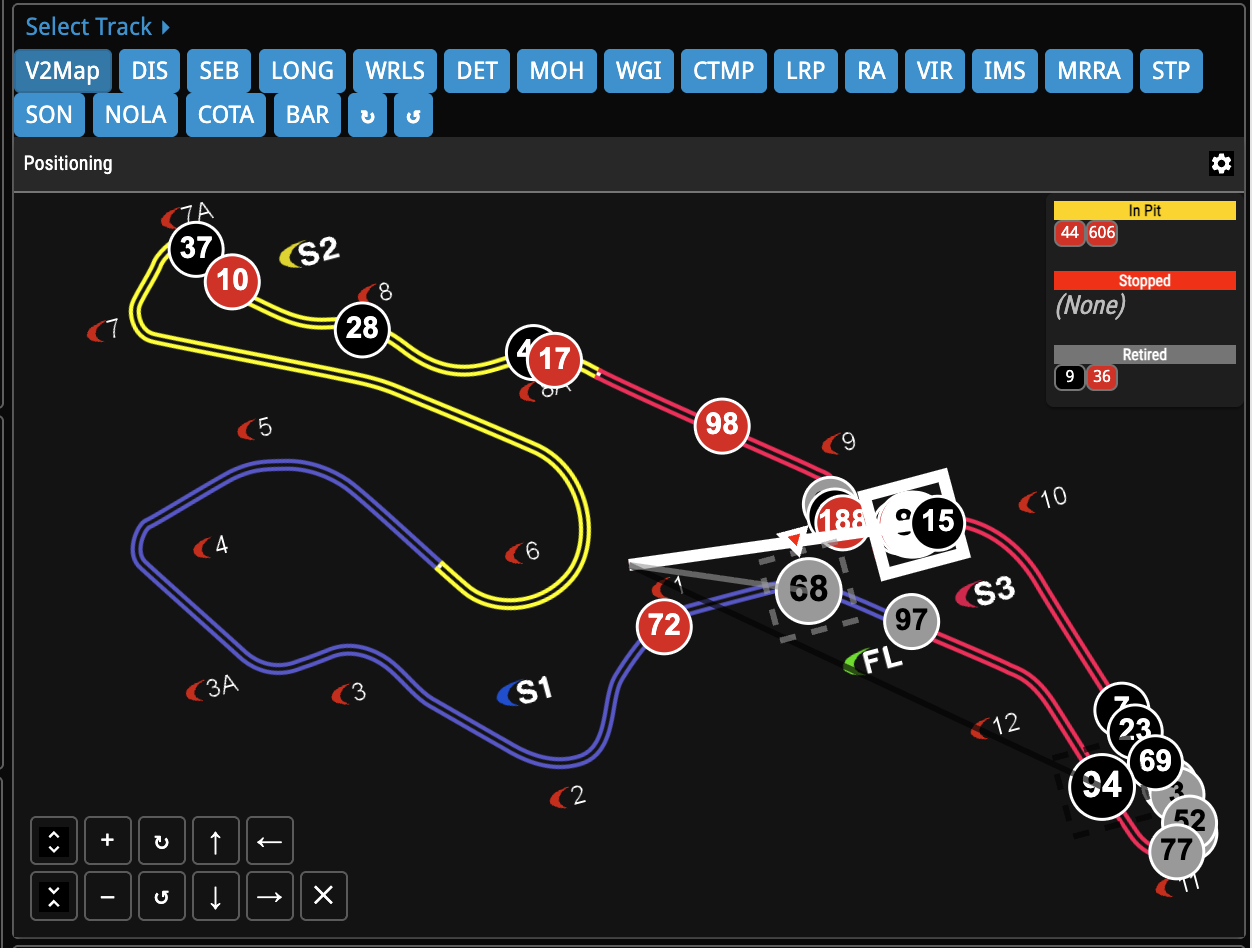
Track Map
The Track Map allows you to select either:
- NEW V2Map which uses Al Kamel V2 positioning data, which may be
GPS, sector, or micro sector based, or
- A traditional 3-sector interpolated map which uses
each car's previous sector times to model movement.
With either style map:
- Hero (#82), sister cars and class leaders can be immediately located by
Target Boxes and Radar Lines.
- NEW The track map may be zoomed, panned,
and rotated.
|
|
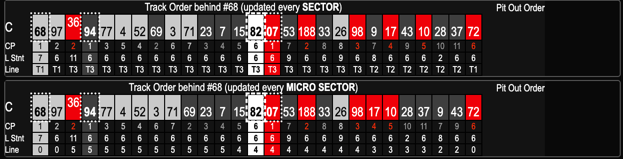
Track Order
The Track Order panel accompanies track map to help visualize
the ordering behind overall leader or SC.
This is particularly useful when cars are overlapped
on the track map or for visualizing series' pass-around
eligibility. You have a choice of two charts whose display is independently
controlled in the Settings tab:
- The traditional Track Order by SECTOR - calculates
with every sector crossing.
- The NEW Track Order by MICRO SECTOR - calculates
with every micro sector crossing.
- Note how cars #3 and #71 have passed car
#69 in the micro sector chart, but not yet in the sector chart.
|
|
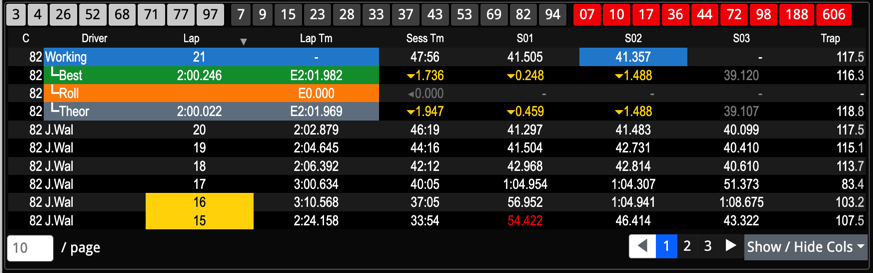
Laps
The Laps panel shows the selected car's lap and sector times.
- The Working lap's (L21) sectors times are recorded as
sectors are completed.
- Faster▲ and
Slower▼ arrows show how each working
lap's sectors compares with his Best
Rolling, and Theoretical lap's sector
times.
- E (estimated) lap times, predict the
working lap time, by using remaining sector times from Best.
|
|
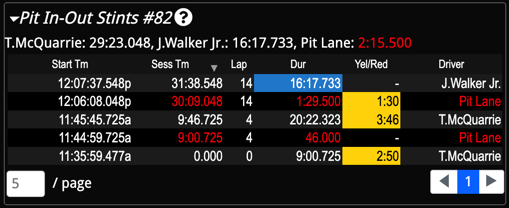
Pits In-Out Stints
The Pit In-Out Stints panel displays both the session
chronology and summary of driver and pit lanes times for the selected car.
The pit-in and pit-out time line crossings divide the chronology.
|
|
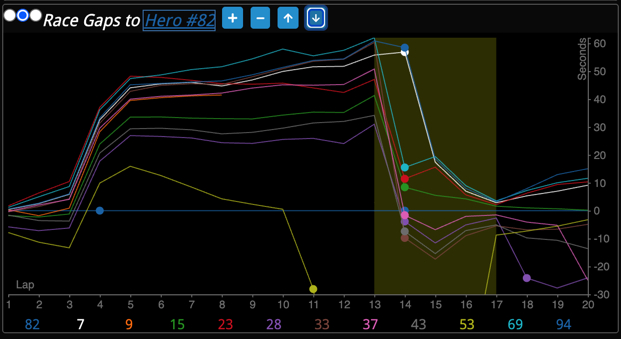
Race Gap Chart
The Race Gap Chart visualizes the race via a lap-by-lap
(x-axis) view of time gaps to the Hero car (y-axis).
- Cars ahead of the hero are above his
Y=0 line while cars behind appear below.
- Faster cars have upwards slopes
while slower cars have downwards slopes.
- Pit stops are indicated as circles.
- Yellow flag periods are displayed as bands.
|
|
|
P1TS - Phoenix American Motorsports Case Study details its practical
use.
|
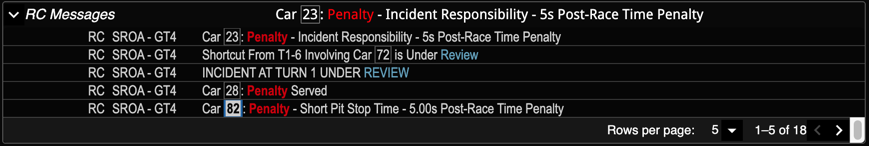
Race Control Messages
NEW The RC Messages panel highlights race control messages.
- The current Active messages appear at the top of the panel
(only 1 is active now)
- The twistie allows you to see Complete message histories for review
(there are 18).
|
|
And More ...
Strat 2 contains specialized displays to help understand pit strategies,
overtake ETAs, and sector time comparisons.